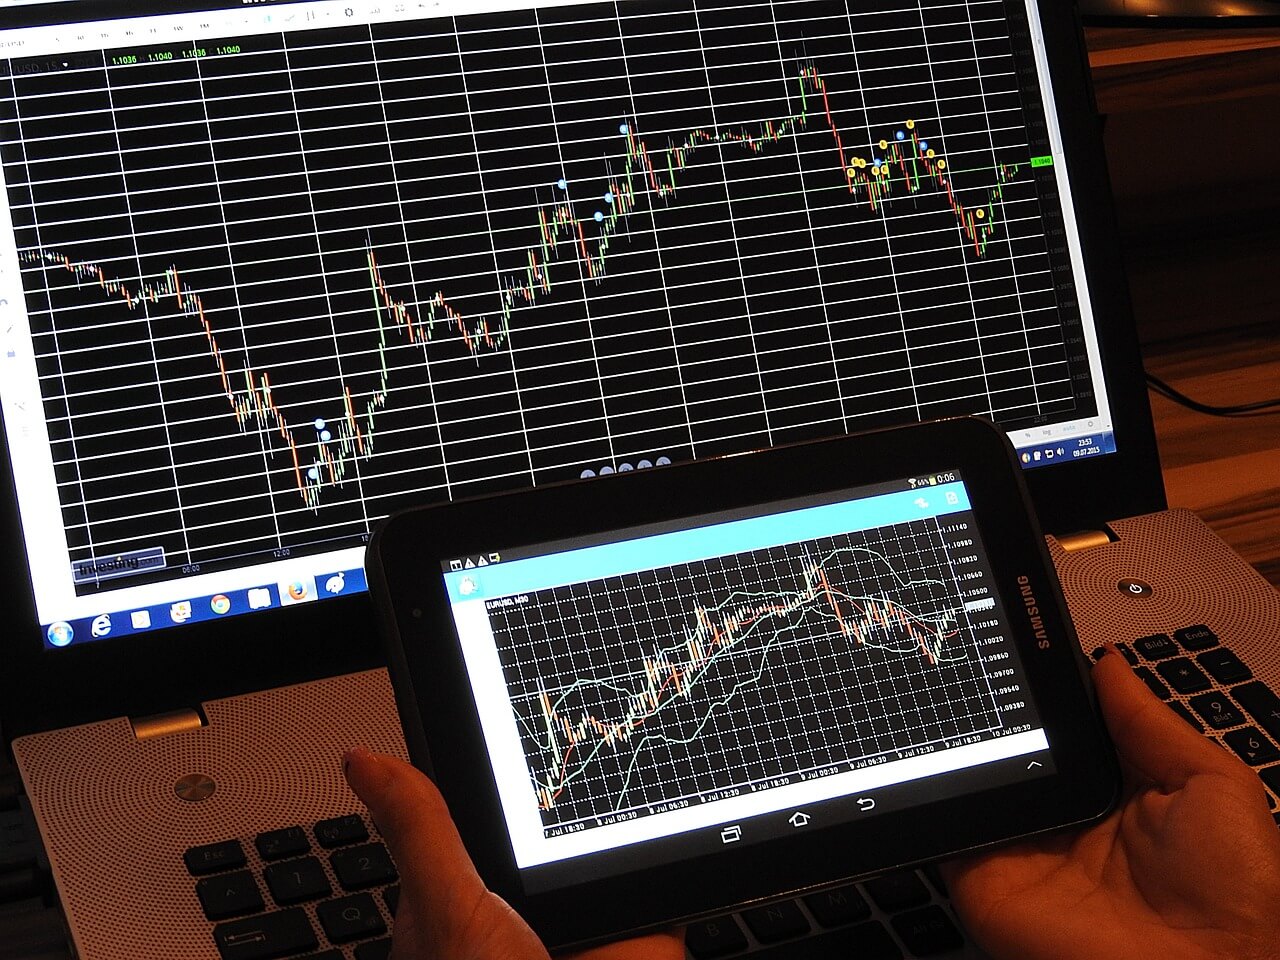
Trade with Candlestick Patterns Like A Pro
Learn to trade like a pro with candlestick patterns. Discover key insights that can enhance your trading strategy and improve your market predictions.
Candlestick patterns help traders understand and predict the direction of price movements. These patterns, which form from the open, high, low, and close prices of a security, offer useful clues about market sentiment and future trends. They are a popular tool in technical analysis, as they provide a visual representation of price action. This action can indicate potential market reversals or new trends, aiding in better trading decisions.
Though candlestick trading requires a technical approach. It is relatively simple, which makes it attractive to those looking to understand market psychology and assess price movement objectively. However, it’s important to remember that candlestick patterns are indicators, not guarantees.
What Are Candlestick Patterns?
Candlestick patterns show price changes in Forex and other markets. The candle itself displays an asset’s open, close, high, and low prices for a given period. The thick part of the candle, known as the ‘body,’ represents the range between the open and close prices. While the thin lines, or ‘wicks,’ show the high and low points. These charts allow traders to quickly analyze price data using just a few bars, hence they are a fundamental tool in technical analysis.
How To Read Candlestick Pattern
Candlestick charts are a key tool in financial analysis, offering a visual representation of price changes over time. Knowing how to interpret these charts is important for anyone looking to trade or understand market trends. Here’s a simplified guide to help beginners and experienced traders understand candlestick patterns.
Each candlestick on the chart shows price movement within a set period. The main parts of a candlestick are the body and the wicks (also called shadows). The body shows the opening and end prices, while the shadows show the highest and lowest prices during that period.
The color of the candle is also important.
A green candle shows that the closing price was higher than the opening, indicating a rise in price, or a bullish trend. On the other hand, a red candle means the end price was lower than the opening price, signaling a price drop, or a bearish trend.
To get a full understanding of candlestick patterns, it’s helpful to use a reference chart. Patterns like the Doji, Hammer, and Shooting Star can give clues about upcoming market shifts. Identifying patterns like the Bullish Engulfing or Bearish Harami can also provide insight into how the market might behave next.
Bullish Candlestick Patterns
Bullish patterns typically appear after a market downtrend and suggest a possible reversal in price direction.
Hammer
A hammer pattern forms when a candle has a small body and a long lower shadow, typically at the end of a downtrend. The shadow should be at least twice the length of the body. This pattern shows that while sellers initially drove the price down, strong buying pressure brought it back up. Green hammers are considered stronger bullish signals than red ones. For this pattern to be confirmed, the following day must show a bullish trend.
Inverted Hammer
The inverted hammer is more like the hammer, but the long shadow is above the body, not below. It indicates buying pressure followed by selling, though the selling wasn’t strong enough to lower the price significantly. This pattern suggests buyers could soon take control, but it isn’t as reliable as the regular hammer.
Bullish Engulfing
This pattern is made up of two candlesticks. The first candle is a small red one, completely overtaken by a larger green candle. Even though the second day starts lower, buyers eventually take over, driving the price higher, signaling a clear victory for the bulls.
Piercing Line
This two-candle pattern starts with a long red candle, followed by a long green one. There’s typically a noticeable gap down between the close of the first and the open of the second. This shows strong buying pressure, as the price moves up toward or above the midpoint of the previous red candle. A bullish candle on the following day confirms this pattern.
Morning Star
A morning star signals hope during a downtrend. It’s a three-candlestick pattern: a long red candle, followed by a short-bodied candle, and then a long green candle. The middle ‘star’ shows a market gap and doesn’t overlap with the larger candles. This pattern suggests that selling pressure is easing, with a bullish reversal on the way.
Three White Soldiers
This strong bullish signal appears over three consecutive days, with long green candles each day. The candles open and close progressively higher than the previous day, indicating consistent buying pressure after a downtrend.
READ ALSO: How to Trade Options Volatility And Pricing
READ ALSO: Best Emerging Markets Funds: All You Need To Know
READ ALSO: How to Read Stock Charts for Beginners
READ ALSO: How to Manage Risk in Trading : Essential Guide
Bearish Candlestick Patterns
Bearish patterns usually form after an uptrend and hint at a possible decline in price, driven by pessimism in the market.
Hanging Man
The hanging man is the bearish version of the hammer, appearing at the top of an uptrend. The lower shadow should be at least twice the length of the body. This pattern suggests a strong sell-off will occurr, but buyers will manage to push the price back up. It indicates the bulls may be losing control of the market.
Shooting Star
This pattern is the opposite of the inverted hammer, forming during an uptrend. It has a small body with a long upper shadow. The price typically gaps higher at the open, rises to a high point, but then closes just above the opening price. This pattern suggests that the price may soon fall, resembling a star falling from the sky.
Bearish Engulfing
This two-candle pattern signals a potential trend reversal. A small green candle is overtaken by a long red one, suggesting a peak in price movement and a likely market downturn. The further the second red candle drops, the stronger the indication of a reversal.
Evening Star
The evening star mirrors the morning star but signals the end of an uptrend. It consists of three candles: a long green one, a short middle candle, and a long red one. This pattern is stronger when the third candle completely erases the gains from the first.
Three Black Crows
This pattern includes three consecutive long red candles, each closing lower than the previous one. There are little to no shadows, signaling that sellers are in control. It indicates the beginning of a bearish trend as selling pressure increases over three days.
Dark Cloud Cover
This two-candle pattern starts with a long green candle followed by a red candle. The red candle opens above the previous green body but closes below its midpoint. This signals that sellers have taken control and driven the price lower. If the shadows are short, it suggests the downtrend is strong and decisive.
3 Important Candlestick Types
The three key candlestick types are Doji, Hammer, and Shooting Star. These are common patterns used to analyze price movements.
Doji
A Doji candle has a very small body, which means the opening and closing prices are nearly the same. This candle often signals a potential trend reversal or uncertainty in the market. There are different variations of Doji candles, such as the Dragonfly Doji, Gravestone Doji, and Long-Legged Doji.
Hammer
The Hammer candle typically points to a bullish reversal. It has a long lower wick, a small body, and little or no upper wick. Although it looks similar to the Dragonfly Doji, the Hammer has a larger body, making it easier to identify.
Shooting Star
The Shooting Star has long upper shadows, a small lower shadow (or none at all), and a small body. This pattern often signals a bearish reversal, as it indicates the price spiked during the period but was pushed back down close to the opening price.
How Many Candlestick Patterns Are There
There are 42 recognized candlestick patterns.And these patterns can be split into simple and complex patterns.
Which Candlestick Pattern is Most Reliable
Bullish Engulfing and Bearish Engulfing patterns are considered as the most reliable candlestick patterns. They clearly indicate a strong reversal in market sentiment.
What is candlestick patterns cheat sheet?
A candlestick patterns cheat sheet is a handy guide that helps you quickly recognize and understand different patterns on a candlestick chart. It breaks down each pattern and shows whether it’s typically seen as a bullish or bearish signal. This makes it very easy for traders to analyze market trends and make informed decisions. You can download the cheat sheet here.
Conclusion:
Mastering candlestick patterns is a key step in developing a solid trading strategy. The Candlestick patterns offer valuable insights into market sentiment and this helps traders make informed decisions about potential trend reversals or continuations. Understanding the nuances of these patterns allows traders to anticipate market movements more effectively even though no pattern guarantees success. You should keep in mind that consistency and practice are essential when using candlestick patterns as part of your analysis


